
Baraja Spectrum-Scan™ LiDAR Comparison

Previously we showcased and compared our simulated skidpad and autocross performance using the Baraja Spectrum-Scan™ LiDAR and our previous LiDAR solution. Now let's take a look into how some of these aspects perform with some real life ontrack data and how the approach used in our perception pipeline differed in order to fully utilise the Baraja Spectrum-Scan™ LiDAR.
What is the Skidpad event?
The skidpad event is one of the dynamic events in which driven and driverless vehicles compete at formula student competitions. This event tests the lateral acceleration of the vehicle, where the vehicle travels in a figure 8 track, completing two clockwise laps then two anticlockwise laps on the other circle, demarcated by the circles lined with cones.
For a driverless vehicle, the sooner in the event the vehicle can map the position of each cone on the track, the sooner and more accurately the reference paths can be calculated. This is as the layout of the track cannot simply be preloaded for use in the event, as each real-life setup of the track varies from the ideal guidelines. However, known features of the layout are leveraged, being the circular nature of each section, and the position of the starting and ending zones in relation to these features. These are the aspects which perception range influences greatly.
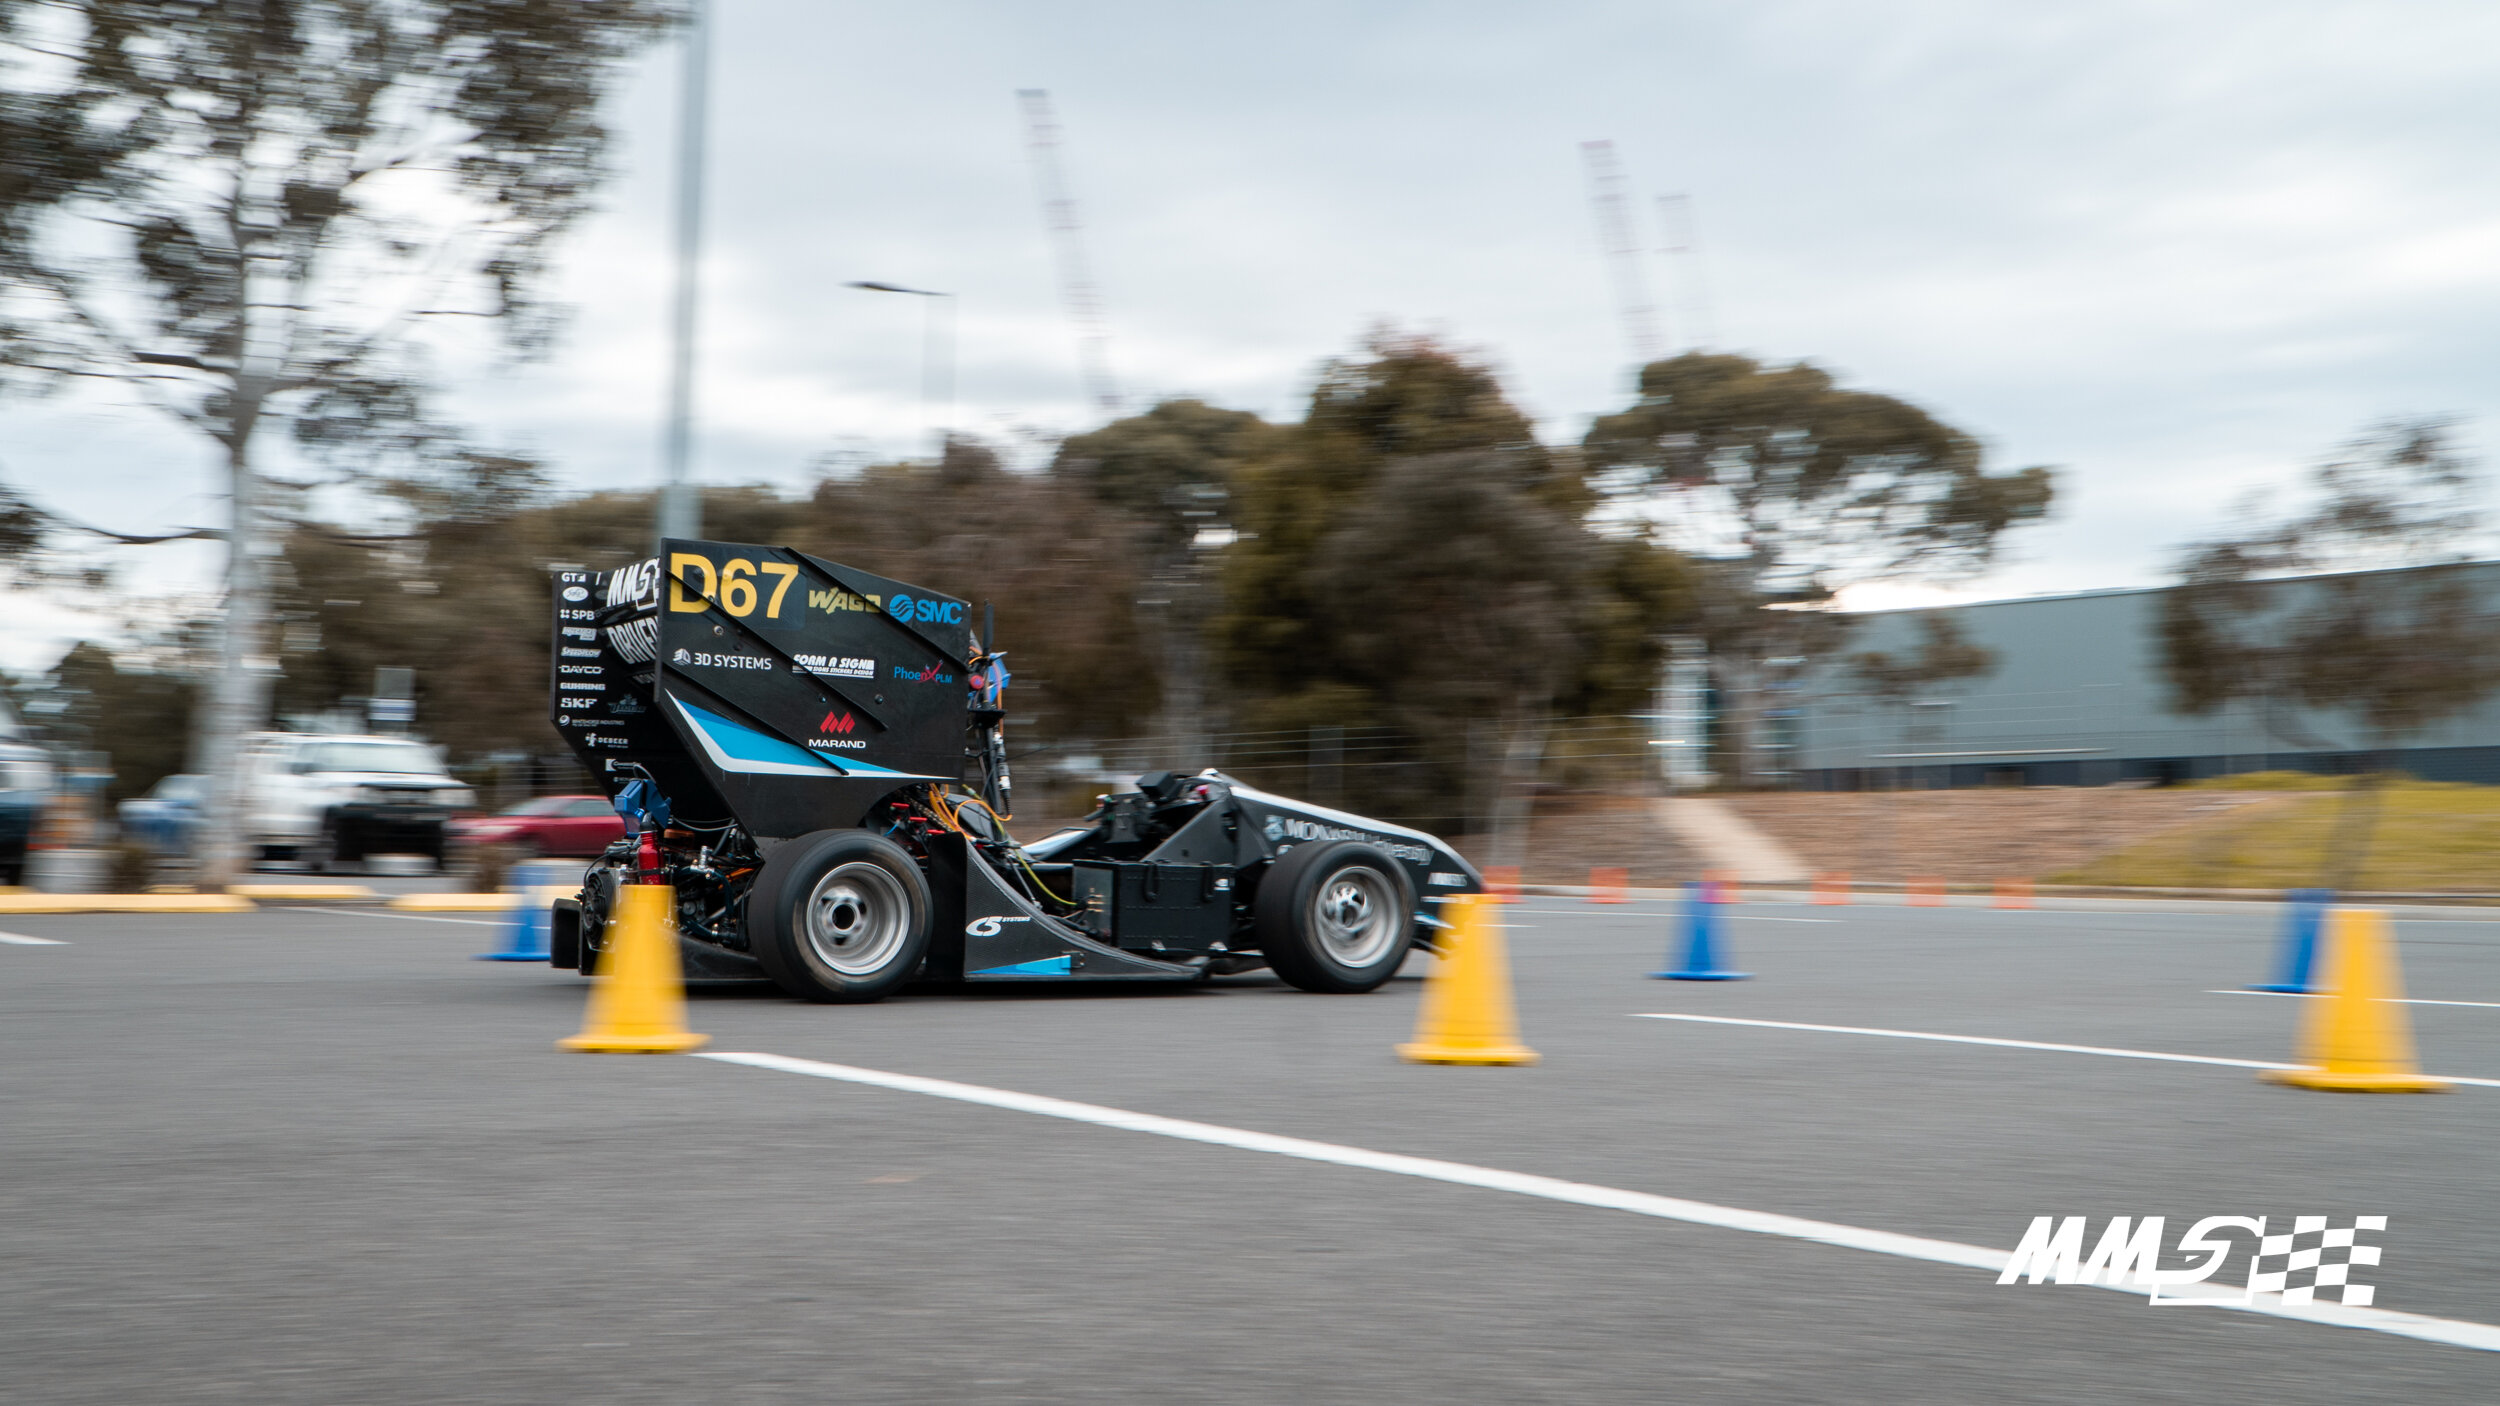
Heading to the track with M19-D
We took our driverless vehicle M19-D out on track to showcase the improvements we have already experienced with the Baraja Spectrum-Scan™ LiDAR.
During this test we attached both the Baraja Spectrum-Scan™ LiDAR and our previous LiDAR to our vehicle and traversed the skidpad course to capture data from both systems simultaneously, in order to compare performance on the same run. The previous LiDAR was placed at the front of the vehicle and the Baraja Spectrum-Scan™ LiDAR placed at the top of the vehicle.
M19-D on track
The video below is a glimpse into our perception and SLAM algorithms running on data collected from the Baraja Spectrum-Scan™ LiDAR.

Cone detection and SLAM visualisation
On the left hand side of the video, a first person view is displayed of the pre and post filtered point cloud from the perspective of the vehicle overlaid with the output of our cone LiDAR cone detection algorithm developed especially for use with the Baraja Spectrum-Scan™ LiDAR.
Compared to our previous LiDAR implementation we have also made changes to our perception pipeline, implementing a brand new solution to make the most of the higher point cloud density offered by the Baraja Spectrum-Scan™ LiDAR, in order to improve our performance.
How the system works
The first step of cone detection is filtering the raw point cloud, determining which points in each frame are likely to belong to a cone on track and not part of the ground plane or the surrounding scenery. This is achieved by computing a mask representing the ground plane by considering all the points in the frame, and then accepting points which lie above this mask. This mask is not a simple plane as the ground surfaces which we encounter are not flat. An example being the surface of the Gloria Pyke Netball Courts where we test our vehicle, where there are gutters between each court which must be considered appropriately. This can also be seen in the visualization above.
A distance filter is then applied as the expected maximum distance of a cone to our vehicle can be calculated prior to starting the event. These filtered out points are displayed in the visualization by the grey points in the scene. While the remaining points are brightly highlighted in the pointcloud.
After these steps, Euclidean clustering is performed on the remaining points and the space characteristics of each cluster are compared against the known properties of the cones in which we encounter. These are displayed through the cone icons placed above the appropriate clusters. From the height of each cluster, we are able to differentiate between cone types. The higher orange cones mark the center region of the track while smaller sized cones mark all other zones. These differing heights are also displayed on the visualization by grey and orange cone icons.
On the right hand side of the video our SLAM algorithm is visualized in real time, where it is building up a cone map of its surroundings and determining the car’s pose in this map by using the cone data provided by our cone detection algorithm. In this visualisation the car pose is represented by the orange object and the cone positions as well as their type and uncertainties are displayed. You will notice that as more observations are made of the same cone, the uncertainty of its position will decrease.
Performance comparison
An aspect which astonished the driverless team was that even from the starting point, using the Baraja Spectrum-Scan™ LiDAR system, most of the end zone as well as the geometry of both circles was already evident. Where with our previous traditional Velodyne LiDAR solution, only the geometry of the starting zone could be determined from the same position.
By breaking down the stint into milestones we can compare the performance of the LiDAR systems. We will compare the amount of progress the car has to make through the stint in order to fully map different regions of the track, where the earlier in the stint the vehicle can map each section, the higher the performance potential is. The Baraja Spectrum-Scan™ LiDAR was able to fully map the end zone of the track after only completing 4.9% of the stint. This is compared to 99% with our previous LiDAR solution. Furthermore, in mapping all other regions of the track, using the Baraja Spectrum-Scan™ LiDAR this was obtained after completing 25.2% of the stint, compared to 67.7% with our previous LiDAR solution.

In the most difficult event our driverless vehicle will encounter, the Baraja Spectrum-Scan™ LiDAR proves that it is a marked improvement over our previous LiDAR solution. We thank the team at Baraja for their ongoing support and we are excited to keep sharing our progress through development on our current vehicle and also the integration process of our 2021 Driverless-Electric Formula SAE car.