
Aero Map for Formula Student - Paul Hendy, 2019
Monash Motorsport Final Year Thesis Collection
The Final Year Thesis, is a technical engineering assignment undertaken by students of Monash University. Monash Motorsport team members often choose to conduct this assignment in conjunction with the team.
These theses have been the cornerstone for much of the team’s success. The purpose of the team releasing the Monash Motorsport Final Year Thesis Collection is to share knowledge and foster progress in the Formula Student and Formula-SAE community.
We ask that you please do not contact the authors or supervisors directly, instead for any related questions please email info@monashmotorsport.com

Summary:
Formula Student and Formula SAE are two design and build engineering competitions based on an automobile racing environment (https://www.formulastudent.de/fsg/). Formula student teams in the early 2000s became aware that aerodynamics even at the low average speeds of a formula student circuit can have a positive effect on performance. In the beginning, teams focused on front and rear wing concepts, although now many teams also use underbody aerodynamics.
This project aims to expand on Monash Motorsports (MMS) tools for analyzing aerodynamics effects on performance by examining how changes to the vehicle's attitude affects the aerodynamic load and moments on the vehicle. These tools were designed to analyze and predict the flow about the car as it moves around the track and changes attitude. The main tool developed was the aero map which is populated using results data from Ansys Fluent CFD simulations and aims to predict aerodynamic force and moments as a function of front and rear ride height, roll, steer and crosswind angle (yaw). Analysis tools in MATLAB and MoTeC were also discussed as they help draw the maximum value from the aero map.
Some aspects of the simulated flow were also validated with the Monash Wind Tunnel to determine the strengths and weaknesses of the CFD predictions. A differential pressure measurement system (DPMS) was developed as a tool to analyze aerodynamic pressures on-track to better understand how the vehicle's attitude affects flow structures on the car. This helps increase confidence and understanding from the simulated values to further increase the aero maps effectiveness.
Introduction:
The complexity of the aerodynamic designs by MMS have progressively become more aggressive, complex and reliant on ‘ground effect’. Ground effect is sensitive to ground clearance which changes as the race car moves around the track. MMS has yet to address the problems with predicting and understanding the effects of vehicle attitudes on aerodynamic performance and vice versa. The attitude of the vehicle in this report will not use the standard vehicle dynamic system of using heave, pitch, roll (angles between the chassis reference and ground reference) and steer instead the vehicle attitude will be characterized by FRH, RRH, roll, steer and yaw.

Figure 1 Histograms of the vehicle attitudes from the fastest endurance lap of the 2018 Formula Student Germany Competition.
This yaw angle can be attributed to two primary causes, cross winds and vehicle slip which occurs when the vehicle is driven to the limit of grip and all 4 tires experience slip. While vehicle speed can influence the Reynolds number and hence the amount of turbulence in the flow. This report uses a standard of 16.67m/s vehicle speed as wind tunnel tests by MMS have shown that the vehicle is Reynolds independent.
An aerodynamic force map (aero map) describes the aerodynamic forces and moments of the vehicle across its feasible attitude parameters (FRH, RRH, roll, steer and yaw). It would be ideal to create a 5-dimensional matrix for each of the six components of the forces and moments however this would create a variety of challenges including the size of the matrix which in this case could have more than 6000 elements and hence require 6000 simulations. With each simulation taking 6 hours the total time for the simulations would be 36000 hours or approximately 4 years!
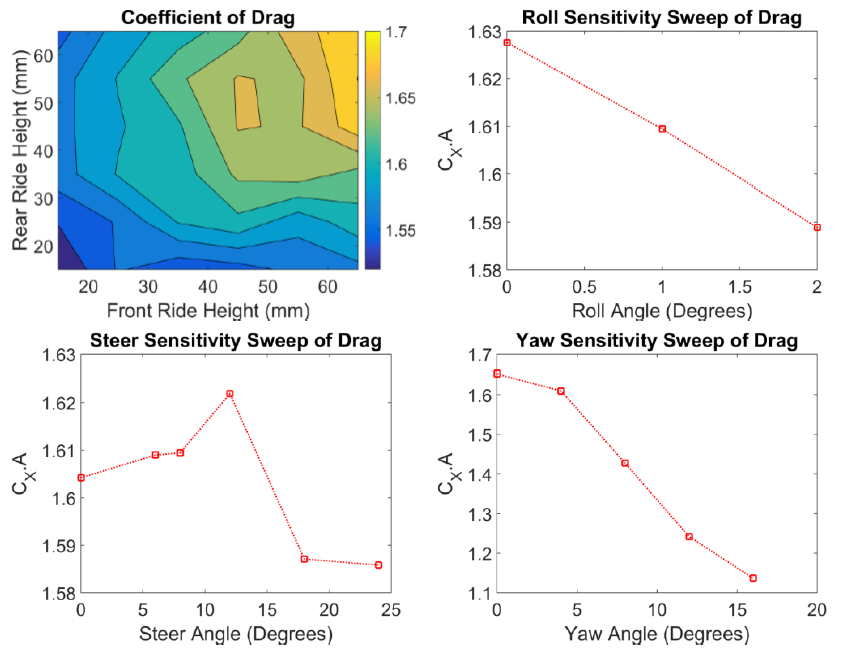
Figure 2 Aero map for the x-direction force component (i.e. drag) across the mapped parameters.
Hence this paper simplifies an aero map to a 6 by 6 ride height map (FRH v. RRH), 3 roll angles, 5 steering angles and 5 yaw angles. Each attitude in the map is a variation on a baseline which means that only 47 simulations are required to create the map which takes 3 days to simulate on the MonARCH (Monash Advanced Research Computing Hybrid) Cluster and whose results for the Cx values can be seen in Figure 2.
For the aero map not to become just an aesthetic plot but a design tool a variety of analysis tools must be created to allow engineers to use the data contained in the map to predict the effect of setup changes and determine where to focus their design efforts. By automating the map process this allows designers to focus on analysis and on developing tools for validating the simulations with on-track and wind tunnel data and use the on-track data for tuning and vehicle development.
Conclusions:
In this project an aero map was successfully produced using Ansys Fluent as a fluid simulation package with assistance from the MonARCH cluster and a python script for batch job submission and results processing developed in conjunction with LEAP Australia. This process was coupled with a variety of analysis tools in both MATLAB and MoTeC i2-Pro which allowed for the maximum value to be extracted from the aero map during the design, tuning and setup phase of development.
Wind tunnel data was also collected to help to gain an understanding of where the simulation was predicting the flow well and where it was failing to predict the flow. A system for collecting on-track data to overcome the wind tunnels limitation on producing results for the vehicle at different attitudes but also to help develop and understand the aero map during real world driving.