
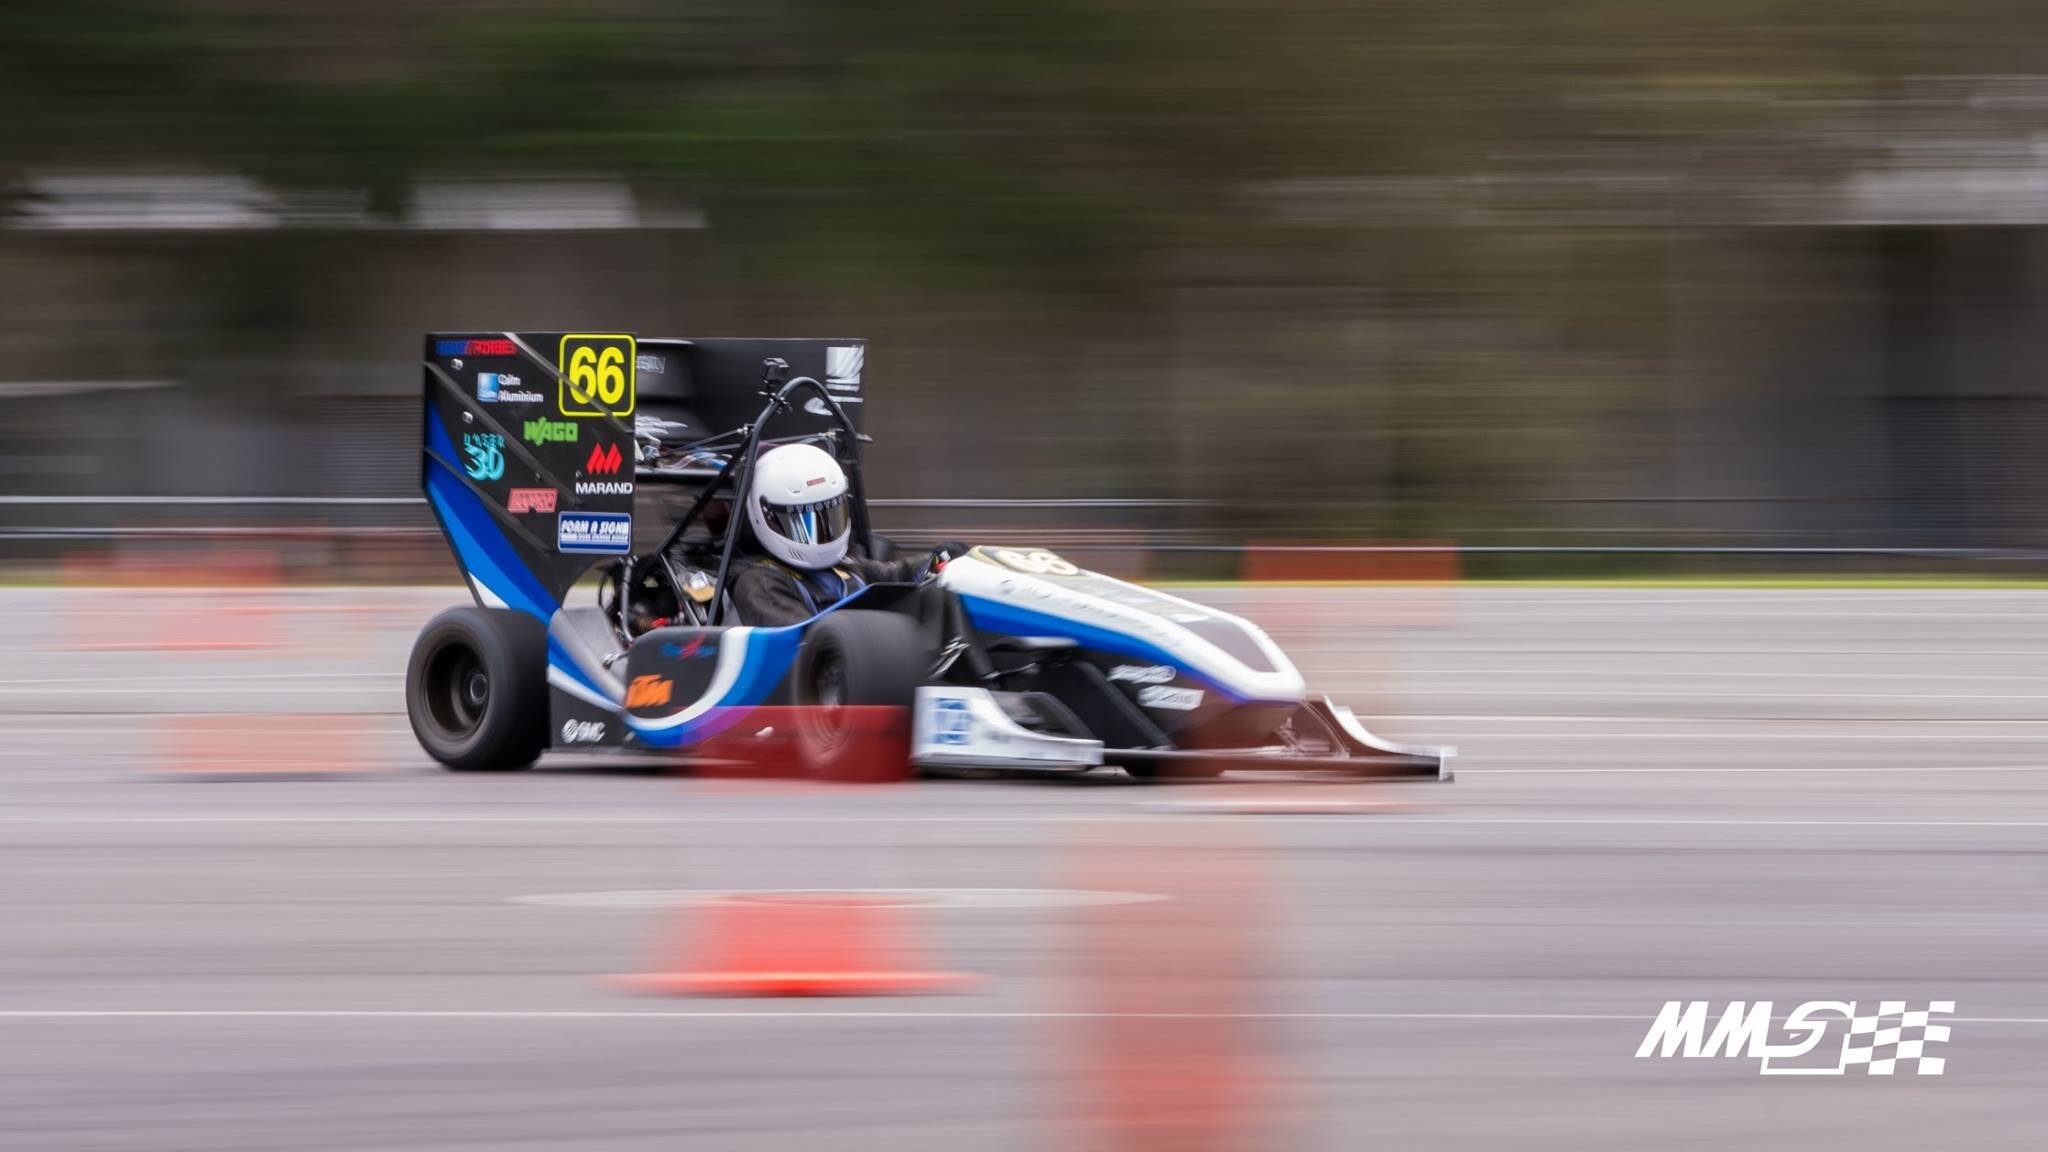
The Racer’s 6th Sense – Why We Test and How We Gather Data
When it comes to testing and tuning the vehicle dynamics of FSAE cars, teams can often be caught up in a guessing game. Variables like camber and toe all affect how much we grip we can get out of our tires and ultimately how much performance we can squeeze out of our cars.
Fortunately, due to the hard work of our specialised data engineer James Murray, and with some nifty sensors generously provided to us by our sponsors Thermofisher, Izze Racing and Bosch Australia, we are able to directly quantify the effects of changes we make.
Racing more often than not comes down to the millisecond, especially as you approach the limits of what is physically possible. To put things into perspective, the top four lap times in the combustion class of the 2017 Formula Student Germany competition were less than two seconds apart, on a 70 second lap. It might not seem like much, but gaining that extra few hundred milliseconds on every turn could be the difference between coming first, and coming fourth.
Large differences are easy to quantify. When comparing a pushbike and a motorcycle, there is obviously a clear winner in terms of speed. However, when you push the limits of technology, it becomes harder and harder to gauge the impact of a change made to your vehicle. Simulations can help overcome this obstacle and must be validated to do so.
This is why testing is ultimately one of the most important stages in our yearly cycle.
When considering the change from a 500cc turbocharged engine, to a 690cc naturally aspirated setup, we expected to see higher amounts of low end torque, resulting in larger longitudinal G-forces. A driver might be able to feel the difference between M16 and M17-C, but this alone would not be adequate to truly test the concepts and draw reliable conclusions. So thanks again to our friends at Izze racing and their IMU (Inertial Measurement Unit), we have been able to produce the following “GG” plot.

GG plot of g-forces in lateral and longitudinal directions
It can be seen that M17-C (shown in black) has improved significantly in regards to straight line (longitudinal) acceleration, as the positive G-force values are higher in magnitude when compared to M16 (shown in orange). Whilst it may seem like cornering power (lateral G force) has decreased slightly, it must be noted that the data from M16’s first drive was taken on a banked track, allowing for slightly higher lateral grip. Clearly, this test has provided validation of our theories, however this is not always the case.
When testing a racecar, there are many confounding variables: temperature, track condition, weather, tire conditions… The list goes on. Most of all however, the factor of human variability exists. Driver skill and the overall drivability of the car affect performance and lap time more than any other factor. Whenever possible, we look to technology to fix this inherent flaw in “human design”.
For the Acceleration Event at the Formula Student competition, some teams will employ launch control technology. While it is almost impossible to achieve a perfect start every time just based off feeling, launch control near guarantees it. Launch control is, in theory, quite a simple concept. By employing front and rear wheel speed sensors , the car is able to intelligently determine whether the rear wheels are slipping or not, and apply throttle correspondingly. There is an optimal ratio of rear to front wheel speed, if the rear sensors are registering much higher values than the front, then the rear wheels are spinning too much, and traction is being lost. Conversely, if the rear wheels aren’t on the verge of spinning, the throttle must be adjusted.
When referring to “drivability”, we come across yet another “hard to quantify” factor – how do we know, quantitatively, how well the car lets itself be driven? Although drivability is often subjective, and largely qualitative, there are factors such as steering response, compliance and tire grip curves, which can be measured and the car adjusted accordingly to improve the overall “feel” of the car.
The M17s employ an anti-roll bar (ARB) to help mitigate some of the issues created by cornering and the subsequent load transfer. Resistance to roll is important not only in regards to maintaining consistent camber values and ensuring maximum grip on the laden wheel, but also has a large effect on steering response. The longer it takes for the car to roll, the longer the car is in a transient state, and potential cornering force is being lost.
In addition to this, the rear ARB allows for quick adjusting and tuning of the sprung roll balance. This allows us to obtain the best compromise between turn in, and steady state cornering, as well as to quickly adjust the cars oversteer or understeer characteristics.

Roll Angle vs Rear ARB Stiffness
In the above graph, we can see the chassis roll as a function of the cornering force (lateral g-force). Being compared here are two different roll stiffnesses, shown in black and blue. From the general trend, as well as the line of best fit, it is clear that the blue set-up results in a lower roll angle being generated, for a given lateral force.
This was done through the use of the linear potentiometers generously provided by Thermofisher, mounted in parallel with the springs and shocks, to obtain data on suspension travel.
While it is possible to make distinctions between changes from driver “feeling” or lap time alone, there are often times where adjustments to the suspension, throttle response and engine tuning cannot be quantified by subjective opinion, and need to be verified through objective data. This is where Monash Motorsport turns to sensors, datalogging, and data analysis allowing us to extract that last 1% of performance, and exhibit that on the race track in December.